How It Works
See the Kargo Platform: Freight Data Backed by Computer Vision
| Kargo | 5 min

Here, we’ll show you what it’s like to work on the Kargo Platform. As you check it out, we welcome any of your questions. You can email us any time at go@mykargo.com.
How It Works
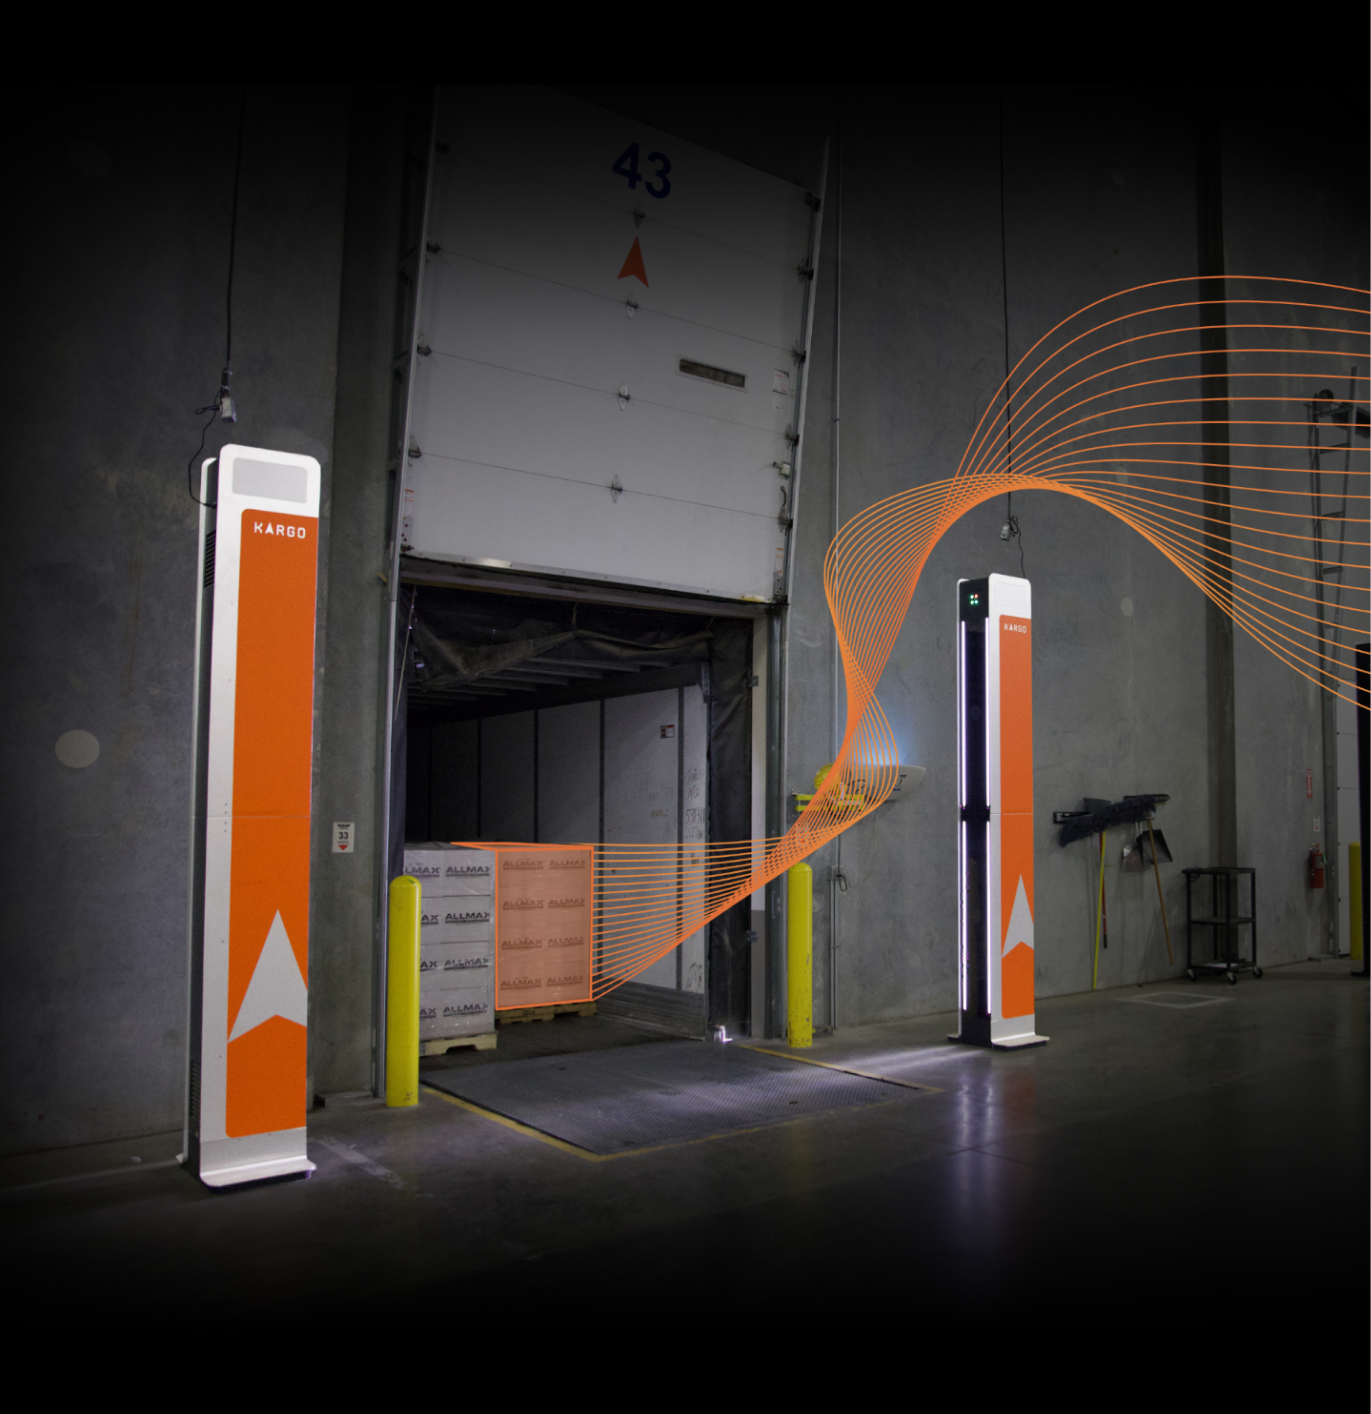
With Kargo Towers at your loading docks, computer vision automatically gathers freight data as pallets enter and exit warehouses. Towers capture information from any barcodes, labels, or marks and deliver data to the Kargo Platform or your existing systems in real time.
This freight data is automatically compared against bills of lading or advanced shipment notices for accuracy. On the Kargo Platform, your records comprise more than shipment information. They include clear images and videos that provide environmental context and visual proof of events.
By translating physical freight into actionable data, you can improve accuracy, productivity, and cost efficiency.
Let’s look at how you can use the Kargo Platform to optimize shipping and receiving.
Shipments
View shipments in table or graph formats. On the Shipments landing page, tables provide a birds-eye view of all shipments, including status updates and exceptions at a glance. You can click into rows for more detail on individual shipments.
As you work with this data, you can manage activity at the shipment level in real time or discover trends across past activity. Data visualizations spotlight patterns and let you gain insight across shipping, receiving, carriers, and more.
On the Kargo Platform: Go to the Shipments page to see your list of shipments in table format. Search and filter by Shipment ID, Bill of Lading, Carrier, Item Name, or Origin/Destination for layered analysis of your logistics data.

On the Kargo Platform: Go to the Analytics page and click Shipments to explore data visualizations. See all shipments, then filter by Direction, Dock ID, and dates. Scroll down to see tables.

Orders
Managing freight at the order level lets you dial into the movement of specific inventory. You can use the data in this section of the Kargo Platform to monitor fulfillment and get visual proof of logistics progress, especially when business units or customers experience urgency.
On the Kargo Platform: Go to the Order page to see your order data in table format. Filter orders by Facility and Direction, and cross-reference shipment detail pages in two clicks.

Pallets
You can explore data at the pallet level, too. You’ll find pallet-level callouts in the Activity tab of shipment detail pages, confirming loading or unloading by pallet number. You can also track pallet volume trends to determine staffing requirements, manage dock doors, and manage carrier partnerships.
On the Kargo Platform: Go to the Analytics page and click on Pallets for data visualizations. See all or filter by Direction, Dock, SKU, and dates. Scroll down for tables.

Exceptions
Exception data is available in table form and as data visualizations, all backed by visual proof of events captured by computer vision. (In warehouses, Kargo Towers flag exceptions right at the loading dock, using a light pattern to alert staff.)
You can use your exception data to discover details about individual exceptions and surface issues related to workflow compliance, like truck driver check-in failures or events that happen outside appointments.
For many companies, Kargo’s computer vision-captured images and videos provide irrefutable visual proof of events, making it faster and easier to resolve OS&D-related claims with complete accuracy.
On the Kargo Platform: Go to the Exceptions page to see the table. Each row includes an Exception ID, Exception Type, Linked Pallet ID or Shipment ID and other status data.

On the Kargo Platform: Click into table rows to see exception detail pages. From there, you can click into linked shipments to see Media captured by Kargo Towers using computer vision.

On the Kargo Platform: Go to Analytics and click on Exceptions for data visualizations and tables. Filter by up to 20 different exception types, priority level, and dates.

Facility
Your shipping and receiving data allows warehouses to align more closely with trucking for improved partnerships and productivity. Streamline driver check-ins, allocate dock doors instantly, and build network effects across warehouse facilities.
On the Kargo Platform: On the Facility page, you can view and sort facility data by Dock Door, Yard Position, Direction, Active, and Exceptions. Toggle between multiple facilities in the upper left corner of the page, next to the navigation menu.

Dwell Times
Review dwell times to discover bottlenecks and optimize productivity. Dwell times can have a high impact on profitability, because they indicate how many trucks a warehouse can load or unload in a given period of time. Long dwell times may also mean a warehouse has to store goods for longer, increasing inventory carrying costs.
On the Kargo Platform: Go to the Analytics page and click Dwell Time to see truck dwell time data in data visualization and table forms. Filter by Dock, dates and times to see total dwell, loading, and idle times. Scroll down to see tables.

Efficiency Rate
Efficiency Rates help teams optimize loading when doors are open. We calculate this metric as the time between the first and last loading event divided by total load time or (Load/Unload Complete - Load/Unload Start) / (Door Close - Door Open). Greater efficiency can drive shorter dwell times.
On the Kargo Platform: Go to the Analytics page and click Efficiency Rate. Filter by Direction, Dock ID, and dates. Scroll down to see tables.

APIs
You can also supply your existing systems with Kargo data via API. Integrations are available for any enterprise resource planning (ERP) system, warehouse management system (WMS), transportation management system (TMS) or yard management system (YMS).
For many companies, working in their own system makes the most sense, because it allows everyone to work together on a centralized platform. In these cases, data integrity and availability is the same as if you were working on the Kargo Platform.
Discover more about how you can improve logistics performance with loading dock data. Request a demo.
Questions?
Connect With us
Ask us anything or drop your email to stay in touch